#!/usr/bin/env python3
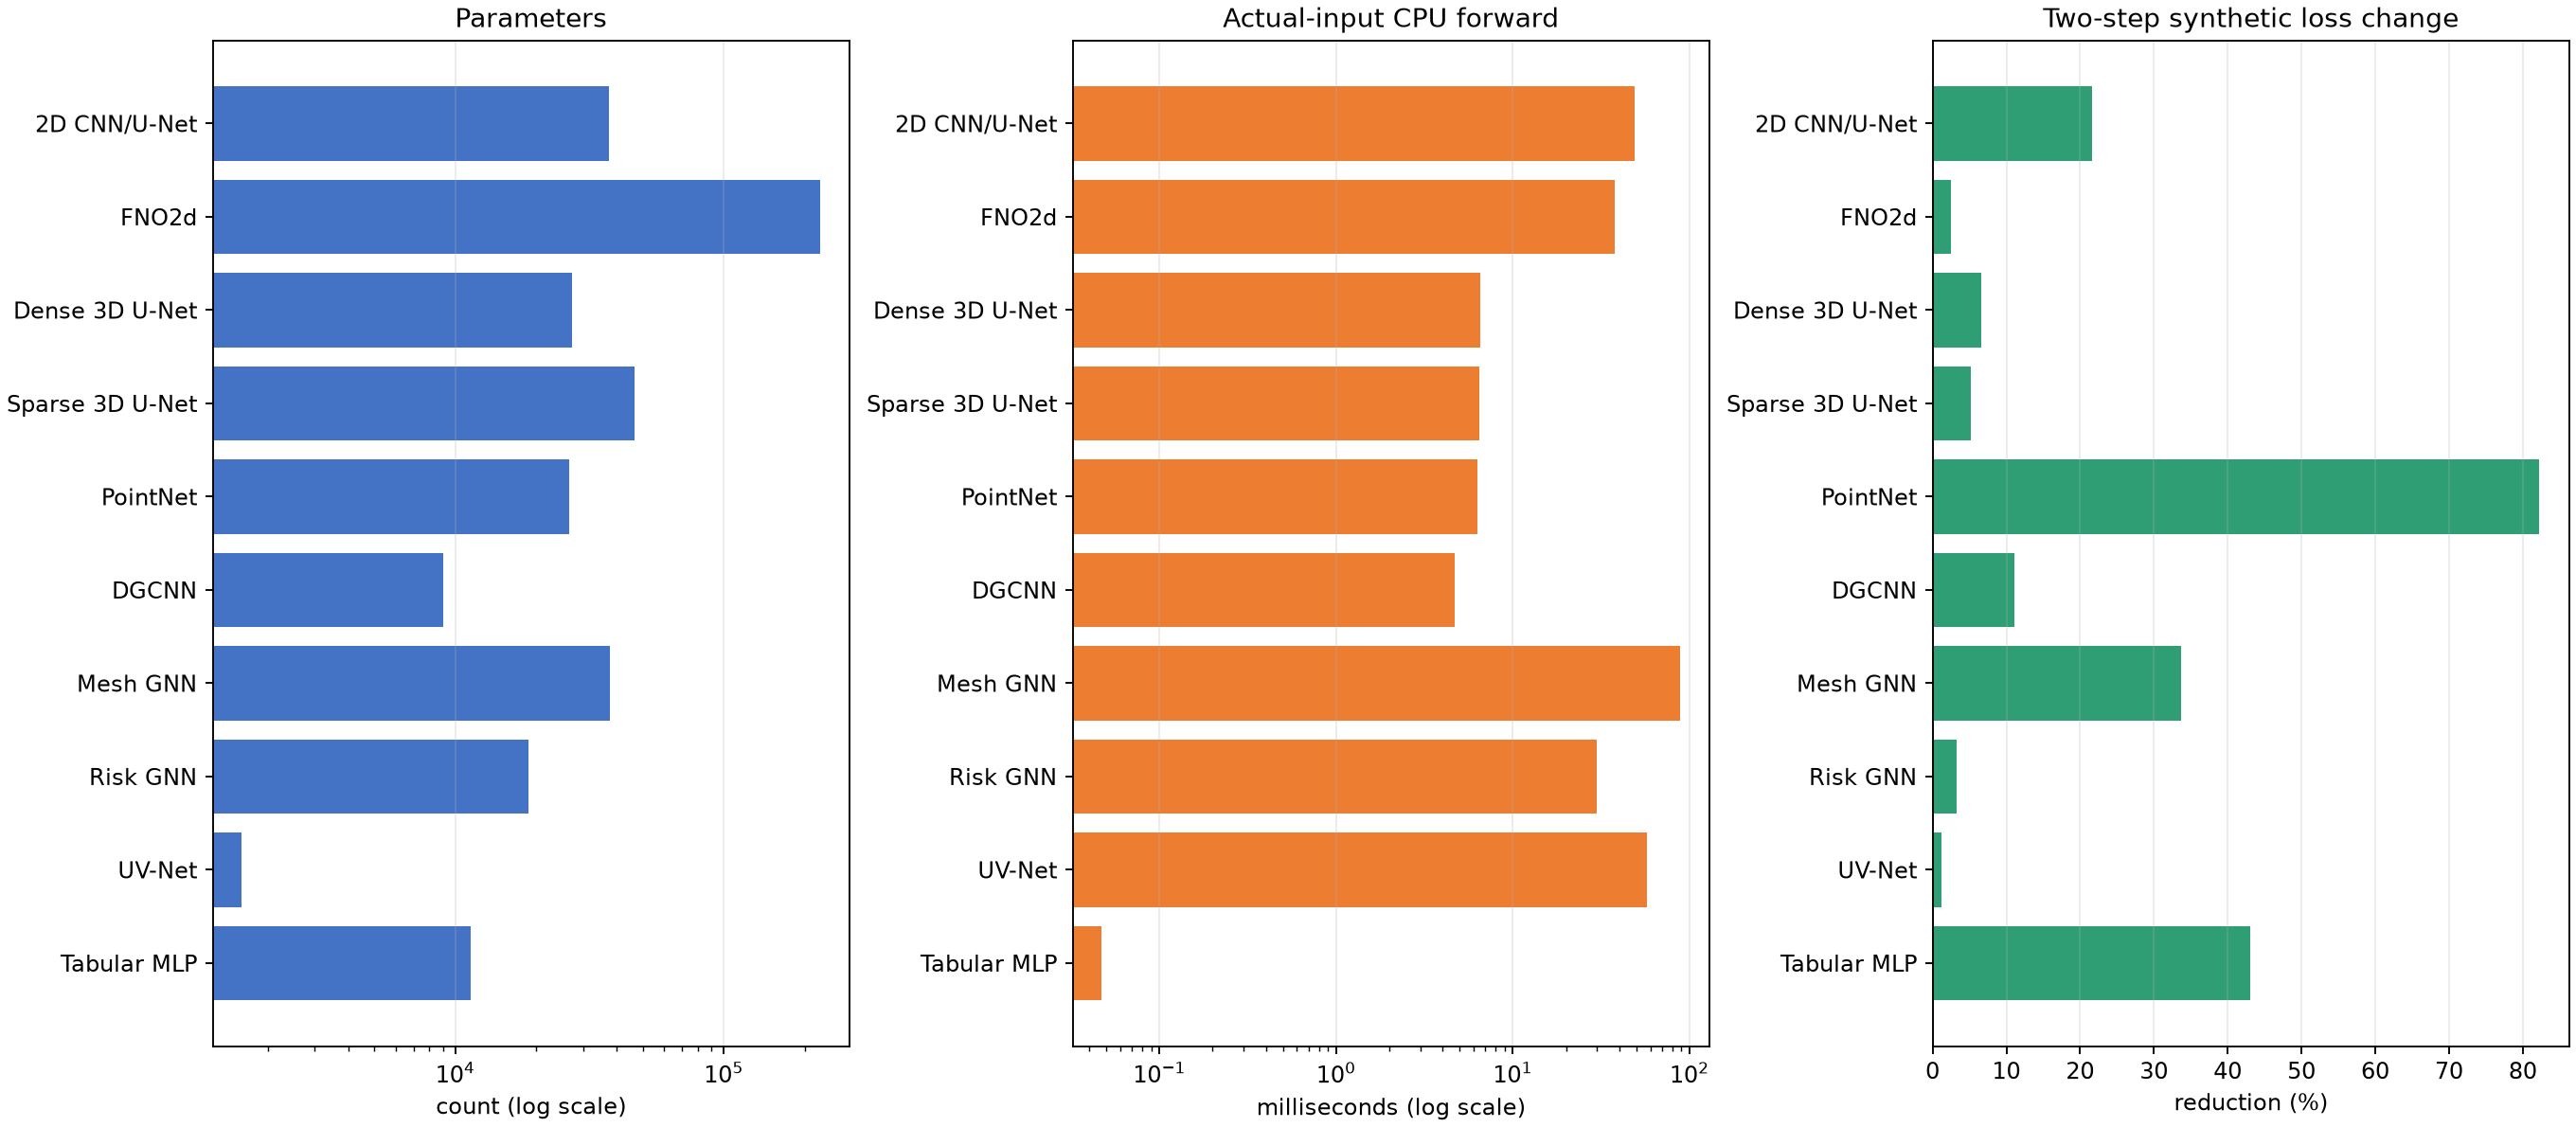
"""Render ME1a in the same three-chart, seven-column format as AC28."""
from __future__ import annotations
import html
import json
from pathlib import Path
import matplotlib
matplotlib.use("Agg")
import matplotlib.pyplot as plt
import numpy as np
HERE = Path(__file__).resolve().parent
ROOT = HERE.parents[1]
MODEL = ROOT / "experiments/ME1a_DT/results/models"
CHART = HERE / "assets/me1a_smoke_comparison.png"
FAMILIES = [
("2D CNN/U-Net", "2D_CNN_UNet", "2d_cnn_unet", "FiLM", "pixel", "cad_multiview_128"),
("FNO2d", "FNO2d", "fno2d", "FiLM", "pixel/field", "cad_multiview_128"),
("Dense 3D U-Net", "3D_UNet", "3d_unet", "FiLM", "voxel", "cad_surface_dense_32"),
("Sparse 3D U-Net", "Sparse_UNet", "sparse_unet", "none", "sparse voxel", "cad_surface_sparse_32"),
("PointNet", "PointNet_segmentation", "pointnet_cad_surface_points", "none", "point", "cad_surface_points"),
("DGCNN", "DGCNN_dynamic_feature_knn", "dgcnn_cad_surface_points", "none", "point", "cad_surface_points"),
("Mesh GNN", "GNN_MeshGraphNet_style", "meshgraphnet", "edge-message", "CAD node", "graph_12000"),
("Risk GNN", "GNN_CAD_risk_deformation_multitask", "cad_risk_deformation_multitask", "edge-message", "CAD node + run", "graph_12000"),
("UV-Net", "UVNet_face_grid_adjacency", "uvnet", "none", "B-Rep face", "faces_uv"),
("Tabular MLP", "tabular_surrogate", "tabular_surrogate", "direct concat", "run", "process_and_geometry"),
]
START = ""
END = ""
def records() -> list[dict]:
smoke = json.loads((MODEL / "report.json").read_text())
fit = json.loads((MODEL / "cad_predictions/report.json").read_text())["models"]
synthetic = {r["family"]: r for r in smoke["synthetic"] if "losses" in r}
output = []
for display, family, synth_name, fusion, domain, source_hint in FAMILIES:
measured = next(r for r in smoke["models"] if r["family"] == family and source_hint in r["source"])
before, after = synthetic[synth_name]["losses"]
trained = fit[display]
output.append({
"model": display, "output_domain": domain, "process_fusion": fusion,
"parameters": measured["params"], "cpu_forward_ms": measured["forward_latency_ms_cpu"],
"synthetic_step_1": before, "synthetic_step_2": after,
"synthetic_reduction_pct": 100 * (before - after) / before,
"weak_loss_final": trained["loss_final"], "weak_ap": trained["average_precision"],
"weak_iou": trained["threshold_iou"], "weak_dice": trained["threshold_dice"],
"weak_selected_epoch": trained["selected_epoch"],
"smoke_source": measured["source"],
})
return output
def chart(rows: list[dict]) -> None:
CHART.parent.mkdir(parents=True, exist_ok=True)
y = np.arange(len(rows))
names = [r["model"] for r in rows]
fig, axes = plt.subplots(1, 3, figsize=(16, 7), constrained_layout=True)
series = (
("parameters", "#4472c4", "Parameters", "count (log scale)"),
("cpu_forward_ms", "#ed7d31", "Actual-input CPU forward", "milliseconds (log scale)"),
("synthetic_reduction_pct", "#2f9e75", "Two-step synthetic loss change", "reduction (%)"),
)
for ax, (key, color, title, xlabel) in zip(axes, series):
ax.barh(y, [r[key] for r in rows], color=color)
ax.set_yticks(y, names)
ax.invert_yaxis()
ax.set_title(title)
ax.set_xlabel(xlabel)
ax.grid(axis="x", alpha=.25)
axes[0].set_xscale("log")
axes[1].set_xscale("log")
axes[2].axvline(0, color="#555", linewidth=.8)
fig.savefig(CHART, dpi=170, facecolor="white")
plt.close(fig)
def block(rows: list[dict]) -> str:
body = []
for r in rows:
synthetic = (f"{r['synthetic_step_1']:.5g} → {r['synthetic_step_2']:.5g} "
f"(+{r['synthetic_reduction_pct']:.1f}%)")
loss = f"{r['weak_loss_final']:.3e}" if r["weak_loss_final"] < 1e-4 else f"{r['weak_loss_final']:.4f}"
weak = (f"loss {loss}; AP {r['weak_ap']:.3f}; "
f"IoU {r['weak_iou']:.3f}; Dice {r['weak_dice']:.3f}")
cells = (r["model"], r["output_domain"], r["process_fusion"],
f"{r['parameters']:,}", f"{r['cpu_forward_ms']:.3f} ms", synthetic, weak)
body.append("
" + html.escape(cells[0]) + "
" +
"".join(f"
{html.escape(v)}
" for v in cells[1:]) + "
")
return f'''{START}
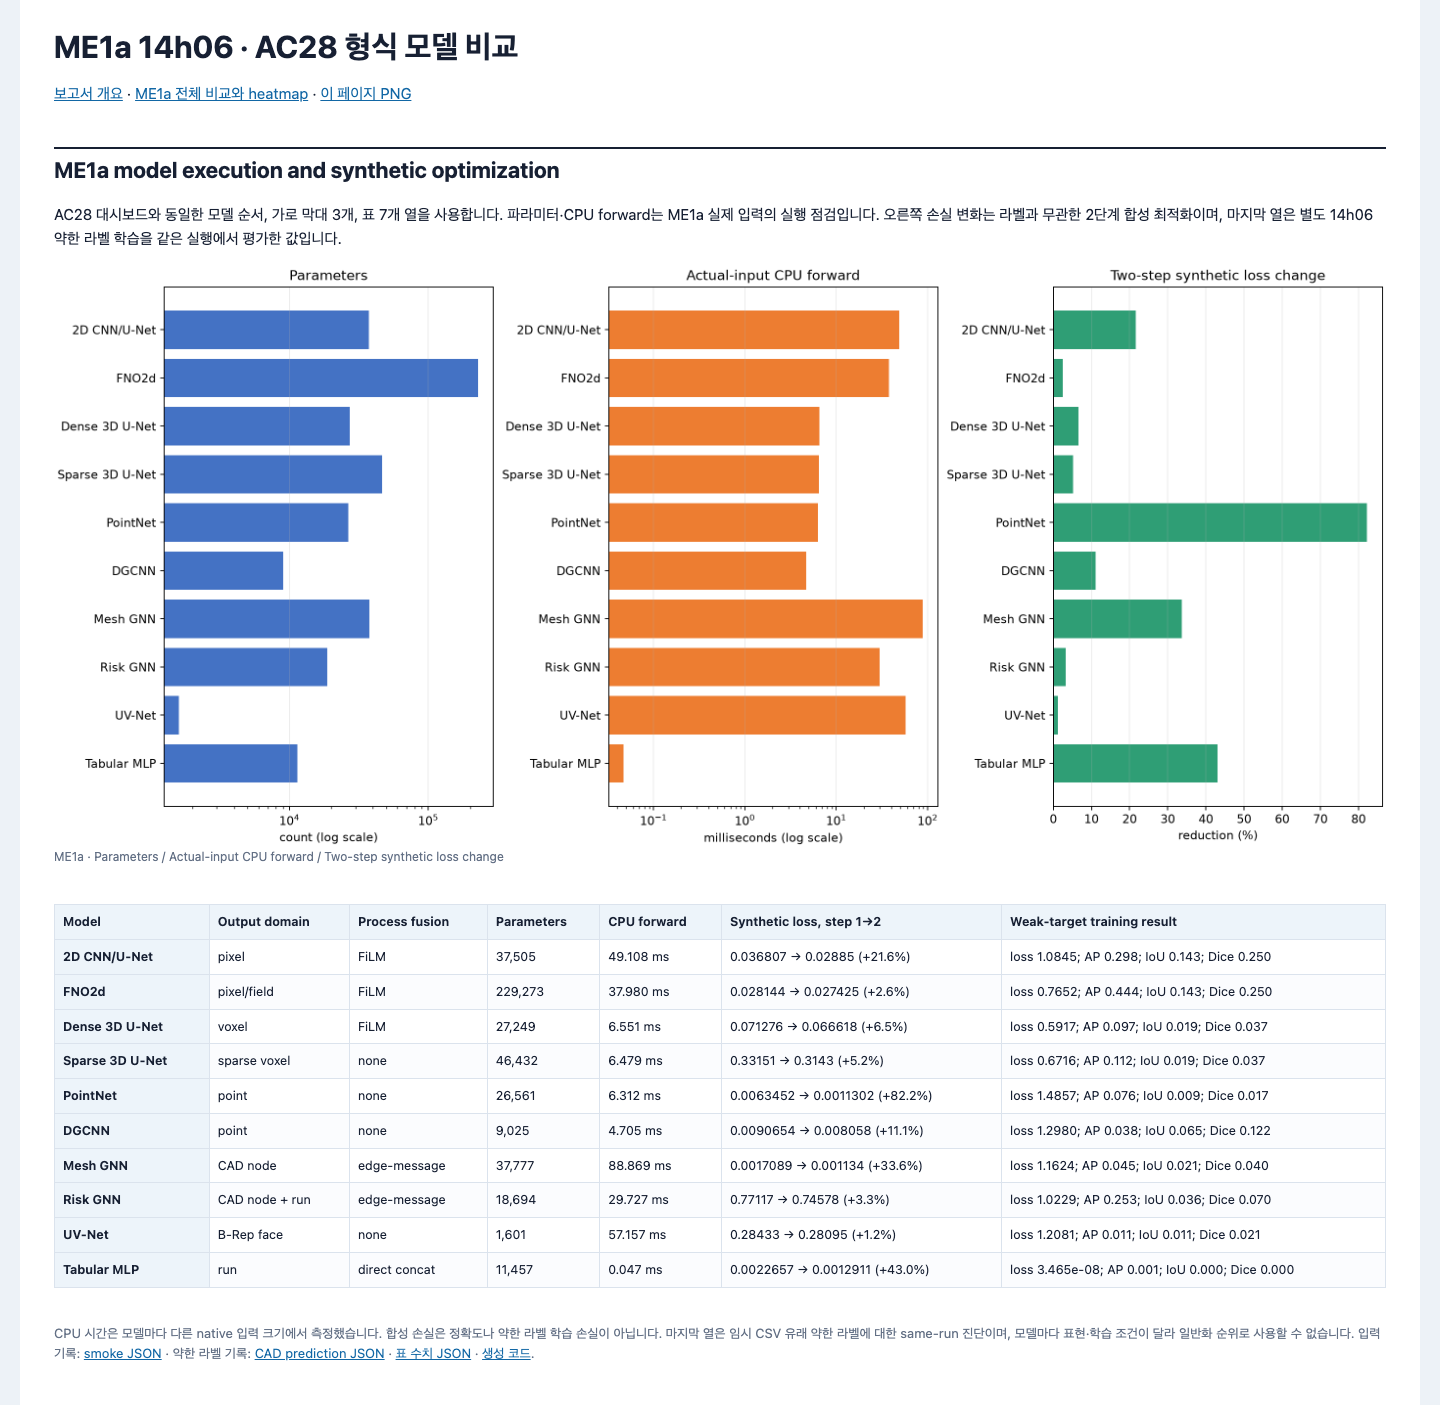
ME1a model execution and synthetic optimization
AC28 대시보드와 동일한 모델 순서, 가로 막대 3개, 표 7개 열을 사용합니다. 파라미터·CPU forward는 ME1a 실제 입력의 실행 점검입니다. 오른쪽 손실 변화는 라벨과 무관한 2단계 합성 최적화이며, 마지막 열은 별도 14h06 약한 라벨 학습을 같은 실행에서 평가한 값입니다.
ME1a · Parameters / Actual-input CPU forward / Two-step synthetic loss change
Model
Output domain
Process fusion
Parameters
CPU forward
Synthetic loss, step 1→2
Weak-target training result
{''.join(body)}
CPU 시간은 모델마다 다른 native 입력 크기에서 측정했습니다. 합성 손실은 정확도나 약한 라벨 학습 손실이 아닙니다. 마지막 열은 임시 CSV 유래 약한 라벨에 대한 same-run 진단이며, 모델마다 표현·학습 조건이 달라 일반화 순위로 사용할 수 없습니다. 입력 기록: smoke JSON · 약한 라벨 기록: CAD prediction JSON · 표 수치 JSON · 생성 코드.
{END}'''
def update_pages(fragment: str) -> None:
page = HERE / "me1a_comparison.html"
source = page.read_text()
if START in source:
source = source[:source.index(START)] + fragment + source[source.index(END)+len(END):]
else:
split_start = source.index('