ME1a_DT with AC28: preprocessing and model results

ME1a used 50 XLS process rows, 6 CSV defect marks, 57,428,249 fused PLY vertices, 5,663 B-Rep faces and 315,967 welded STEP-mesh vertices. The same eight graph budgets as AC28 were prepared. All 18 recorded architecture forward/backward checks passed; 10 prediction-model families and 5 diffusion variants completed weak-label diagnostic fitting.

Interpretation: PLY-to-CAD registration and CSV defect extents are not independently validated. Training metrics below measure fit to weak masks on the same physical run. They are not held-out accuracy or evidence of design transfer.

315,967 STEP mesh vertices12,324 finest graph nodes5,663 B-Rep faces57,428,249 fused PLY vertices18 architecture checks10 prediction-model families5 diffusion variants

Graph nodes change what the representations retain

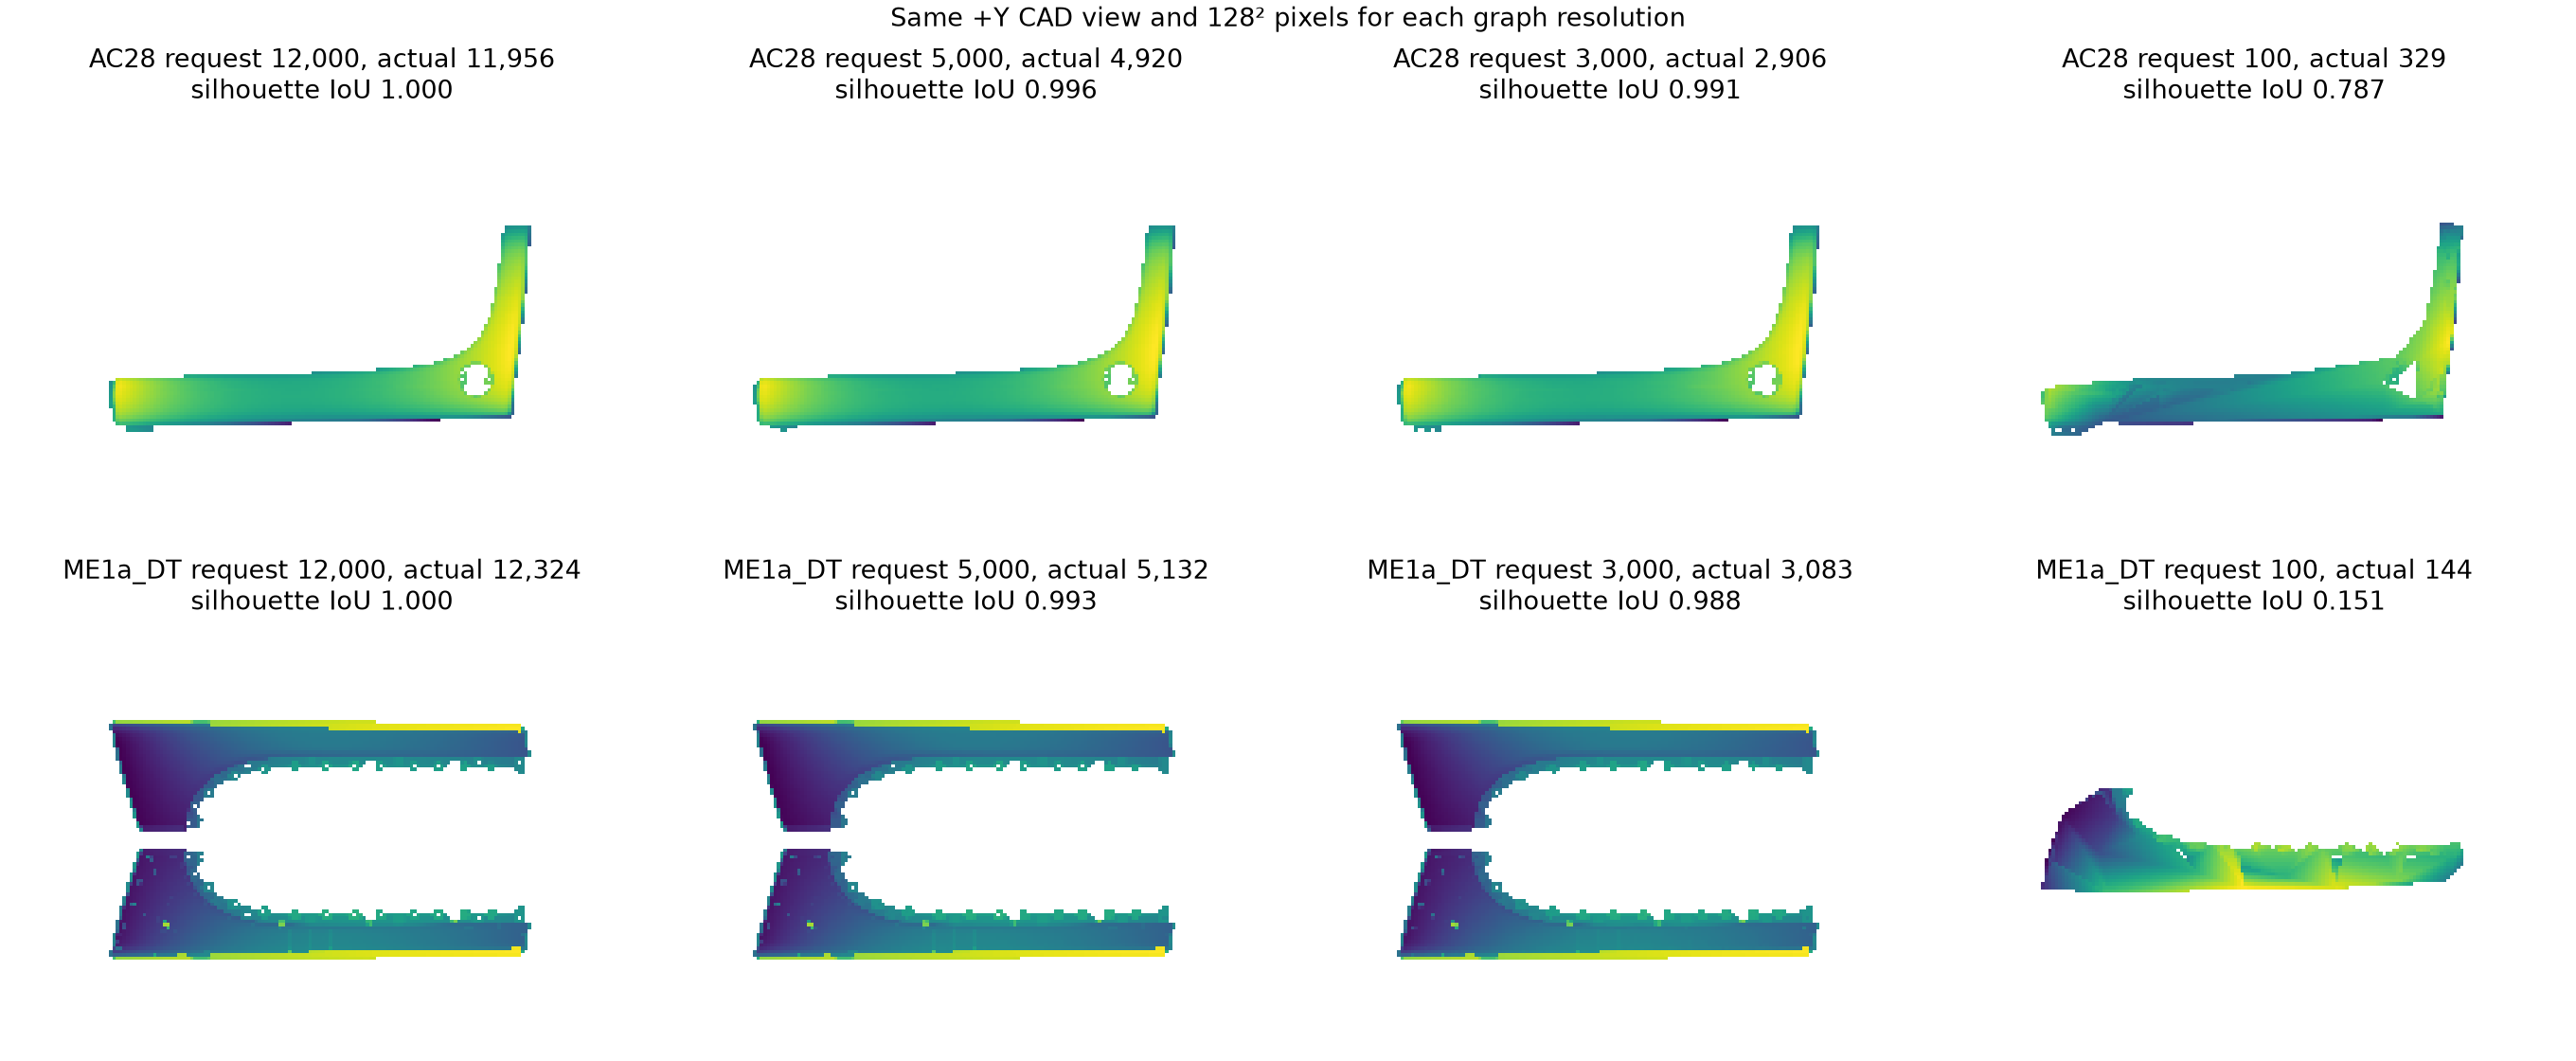
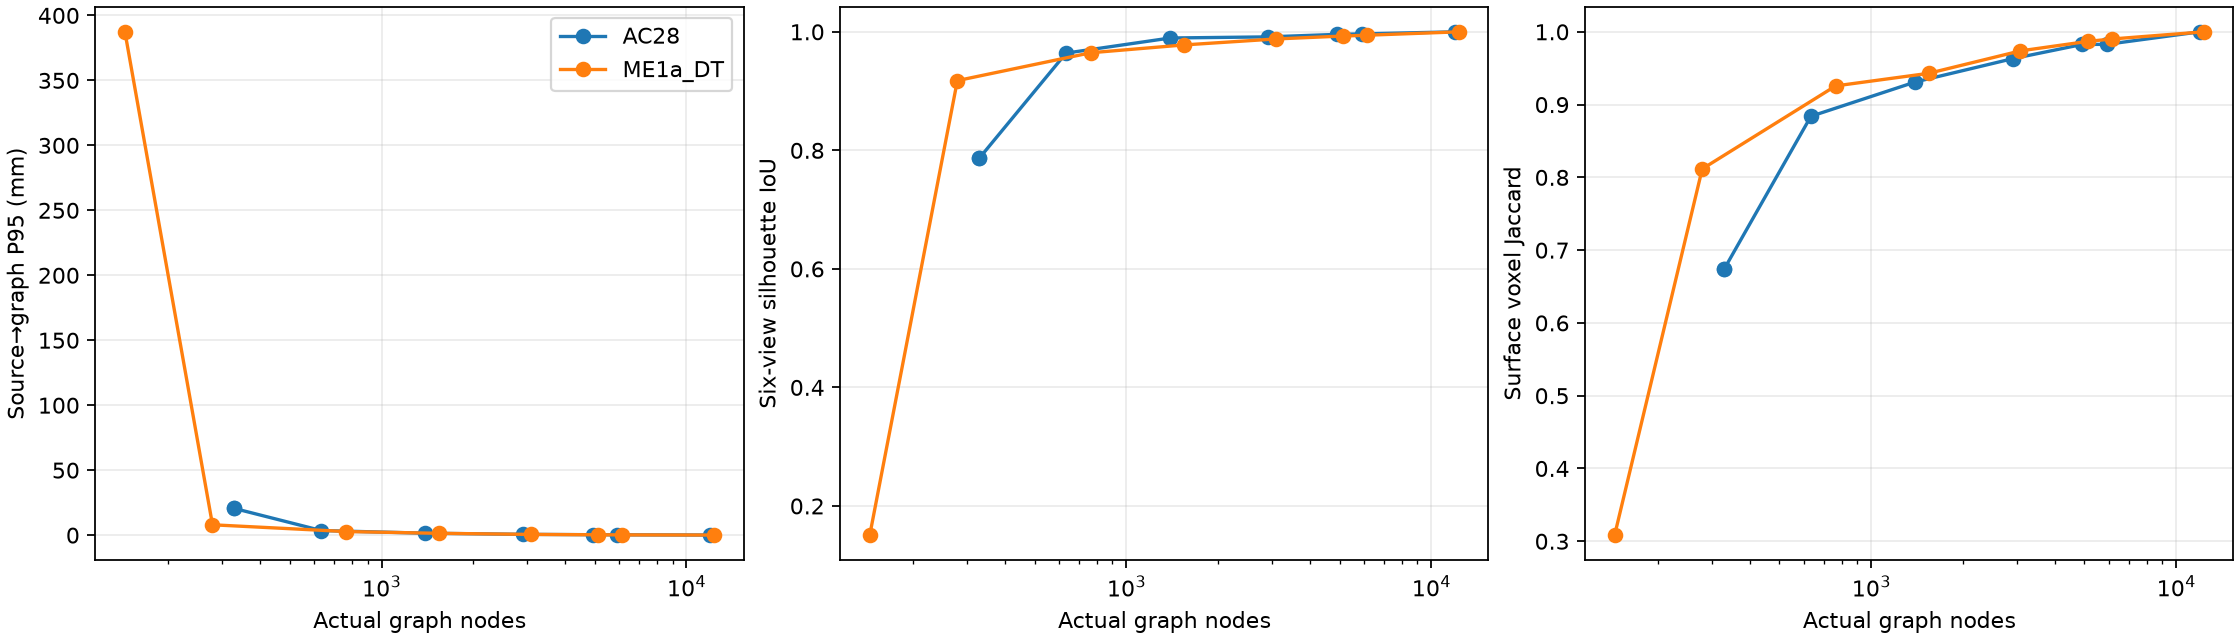
Each part is compared with its own finest graph. P95 is sampled source-surface error in mm; six-view image silhouette IoU and surface voxel Jaccard are measured after regenerating each representation from every graph.

Requested nodesAC28 actualME1a actualAC28 P95 mmME1a P95 mmAC28 image IoUME1a image IoUAC28 voxel JaccardME1a voxel JaccardAC28 weak-label transfer IoUME1a weak-label transfer IoU
12,00011,95612,3240.0750.0661.0001.0001.0001.0001.0001.000
6,0005,9256,1550.2520.1980.9970.9940.9830.9900.7410.333
5,0004,9205,1320.3280.2760.9960.9930.9830.9870.0340.175
3,0002,9063,0830.6130.5630.9910.9880.9630.9740.2780.129
1,5001,3931,5431.4881.4030.9900.9780.9310.9430.3610.079
7506347643.5522.7700.9640.9650.8840.9260.3410.057
30032927920.5357.9630.7870.9180.6740.8120.3260.030
10032914420.535387.3560.7870.1510.6740.3090.3260.017

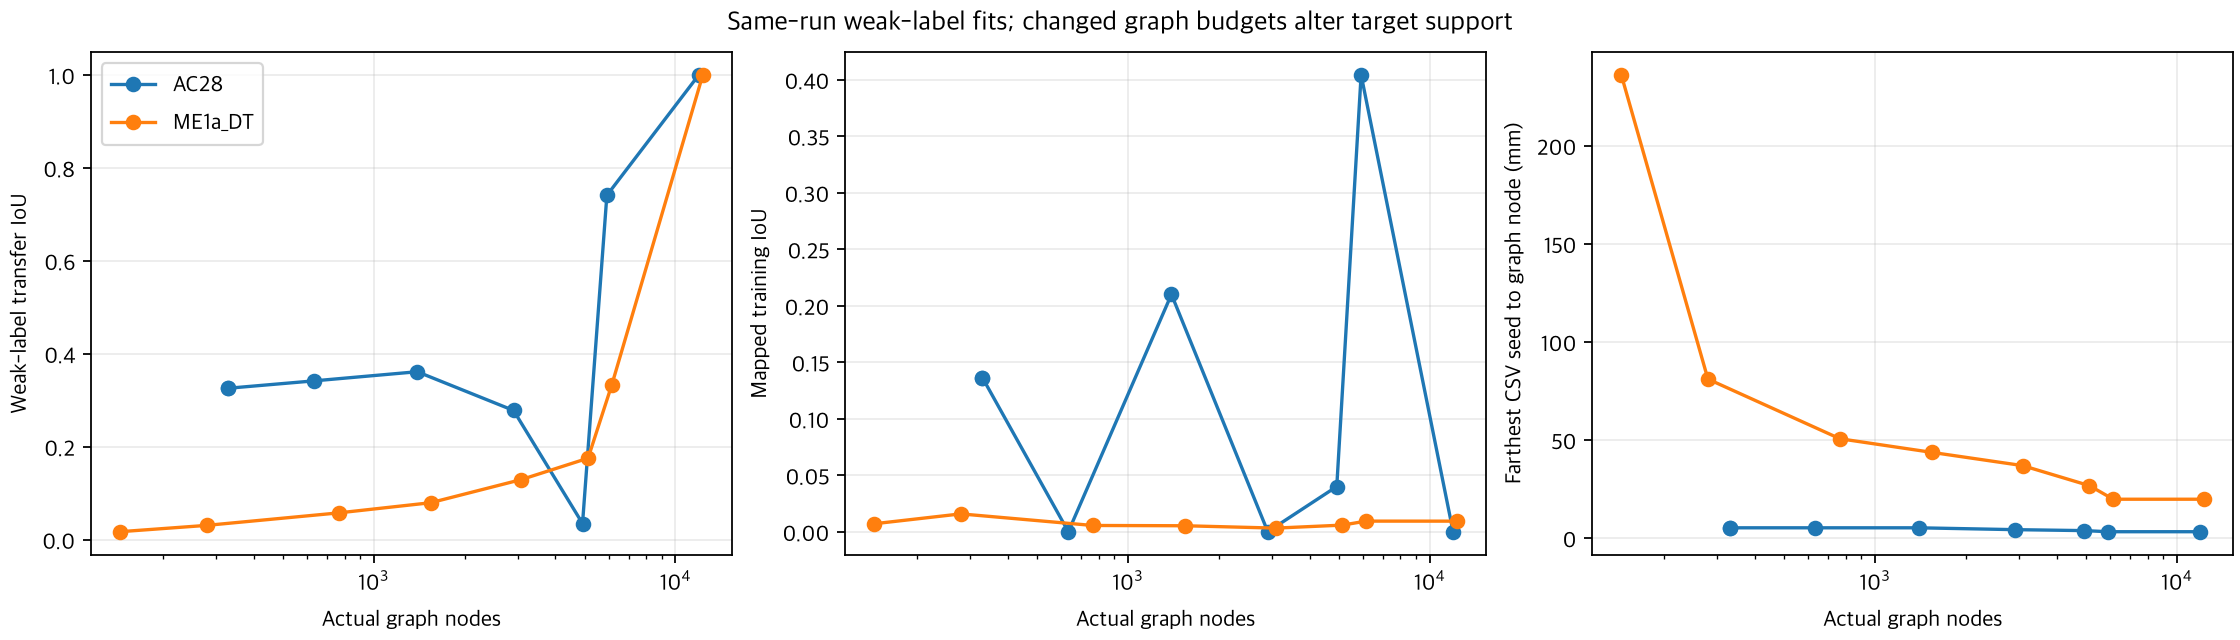
ME1a at 3,083 nodes: 0.563 mm P95 and 0.988 image IoU. ME1a at 144 nodes: 387.356 mm P95 and 0.151 image IoU. Fine geometry views can remain similar while 10 mm defect masks lose support.

AC28 and ME1a depth views by graph budgetRepresentation quality versus node countWeak label and training fit by node count

Representation metrics CSV · All graph-resolution fits CSV · ME1a interactive graph viewer

Source and visual inspection

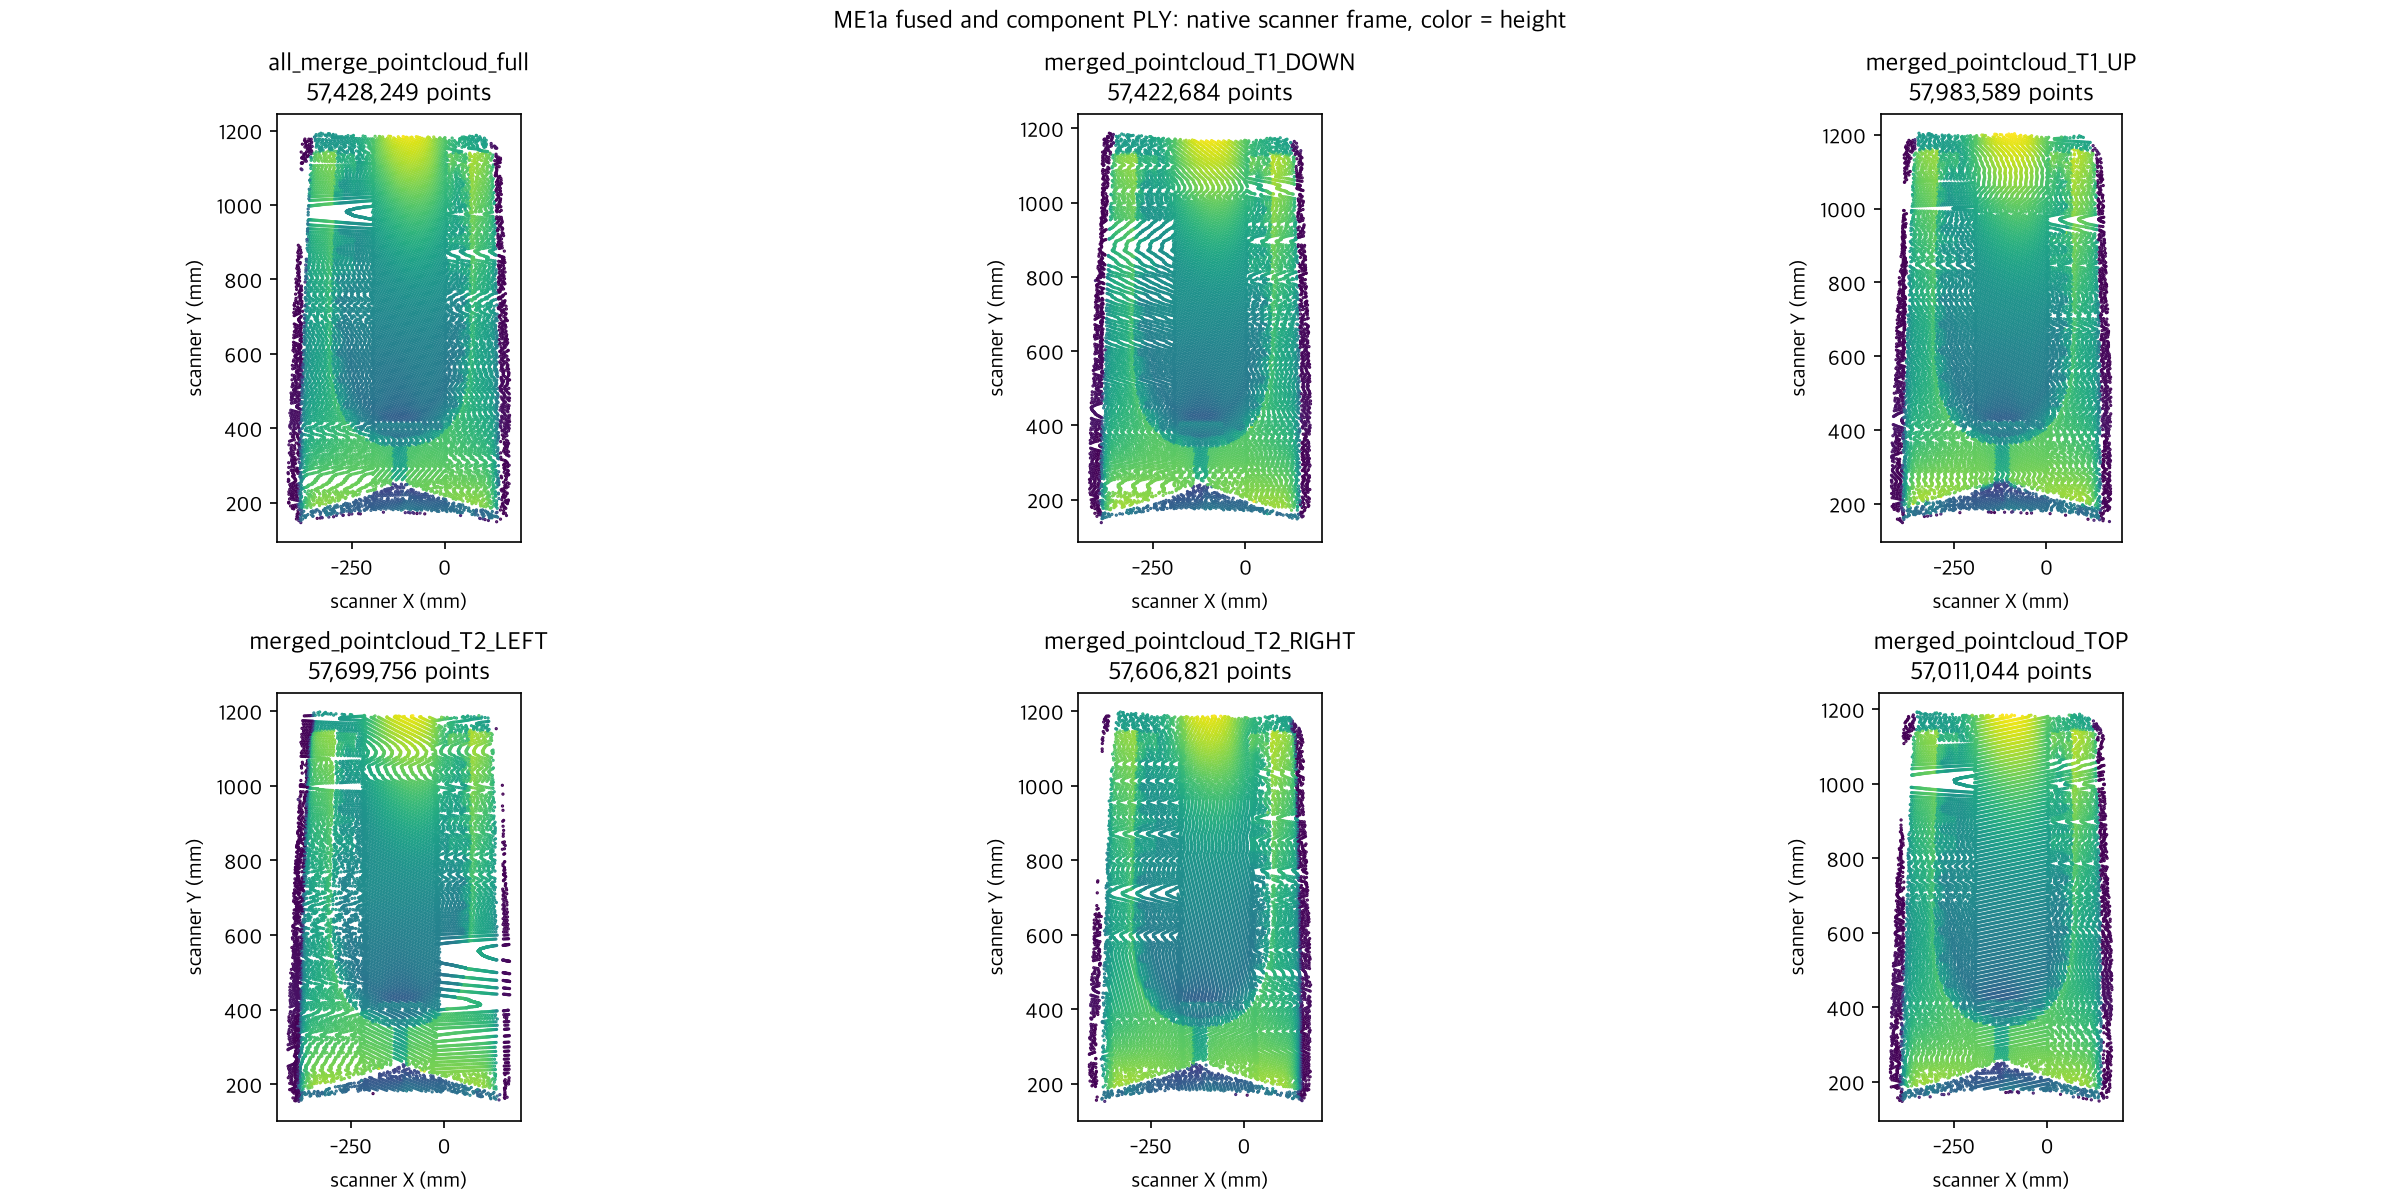
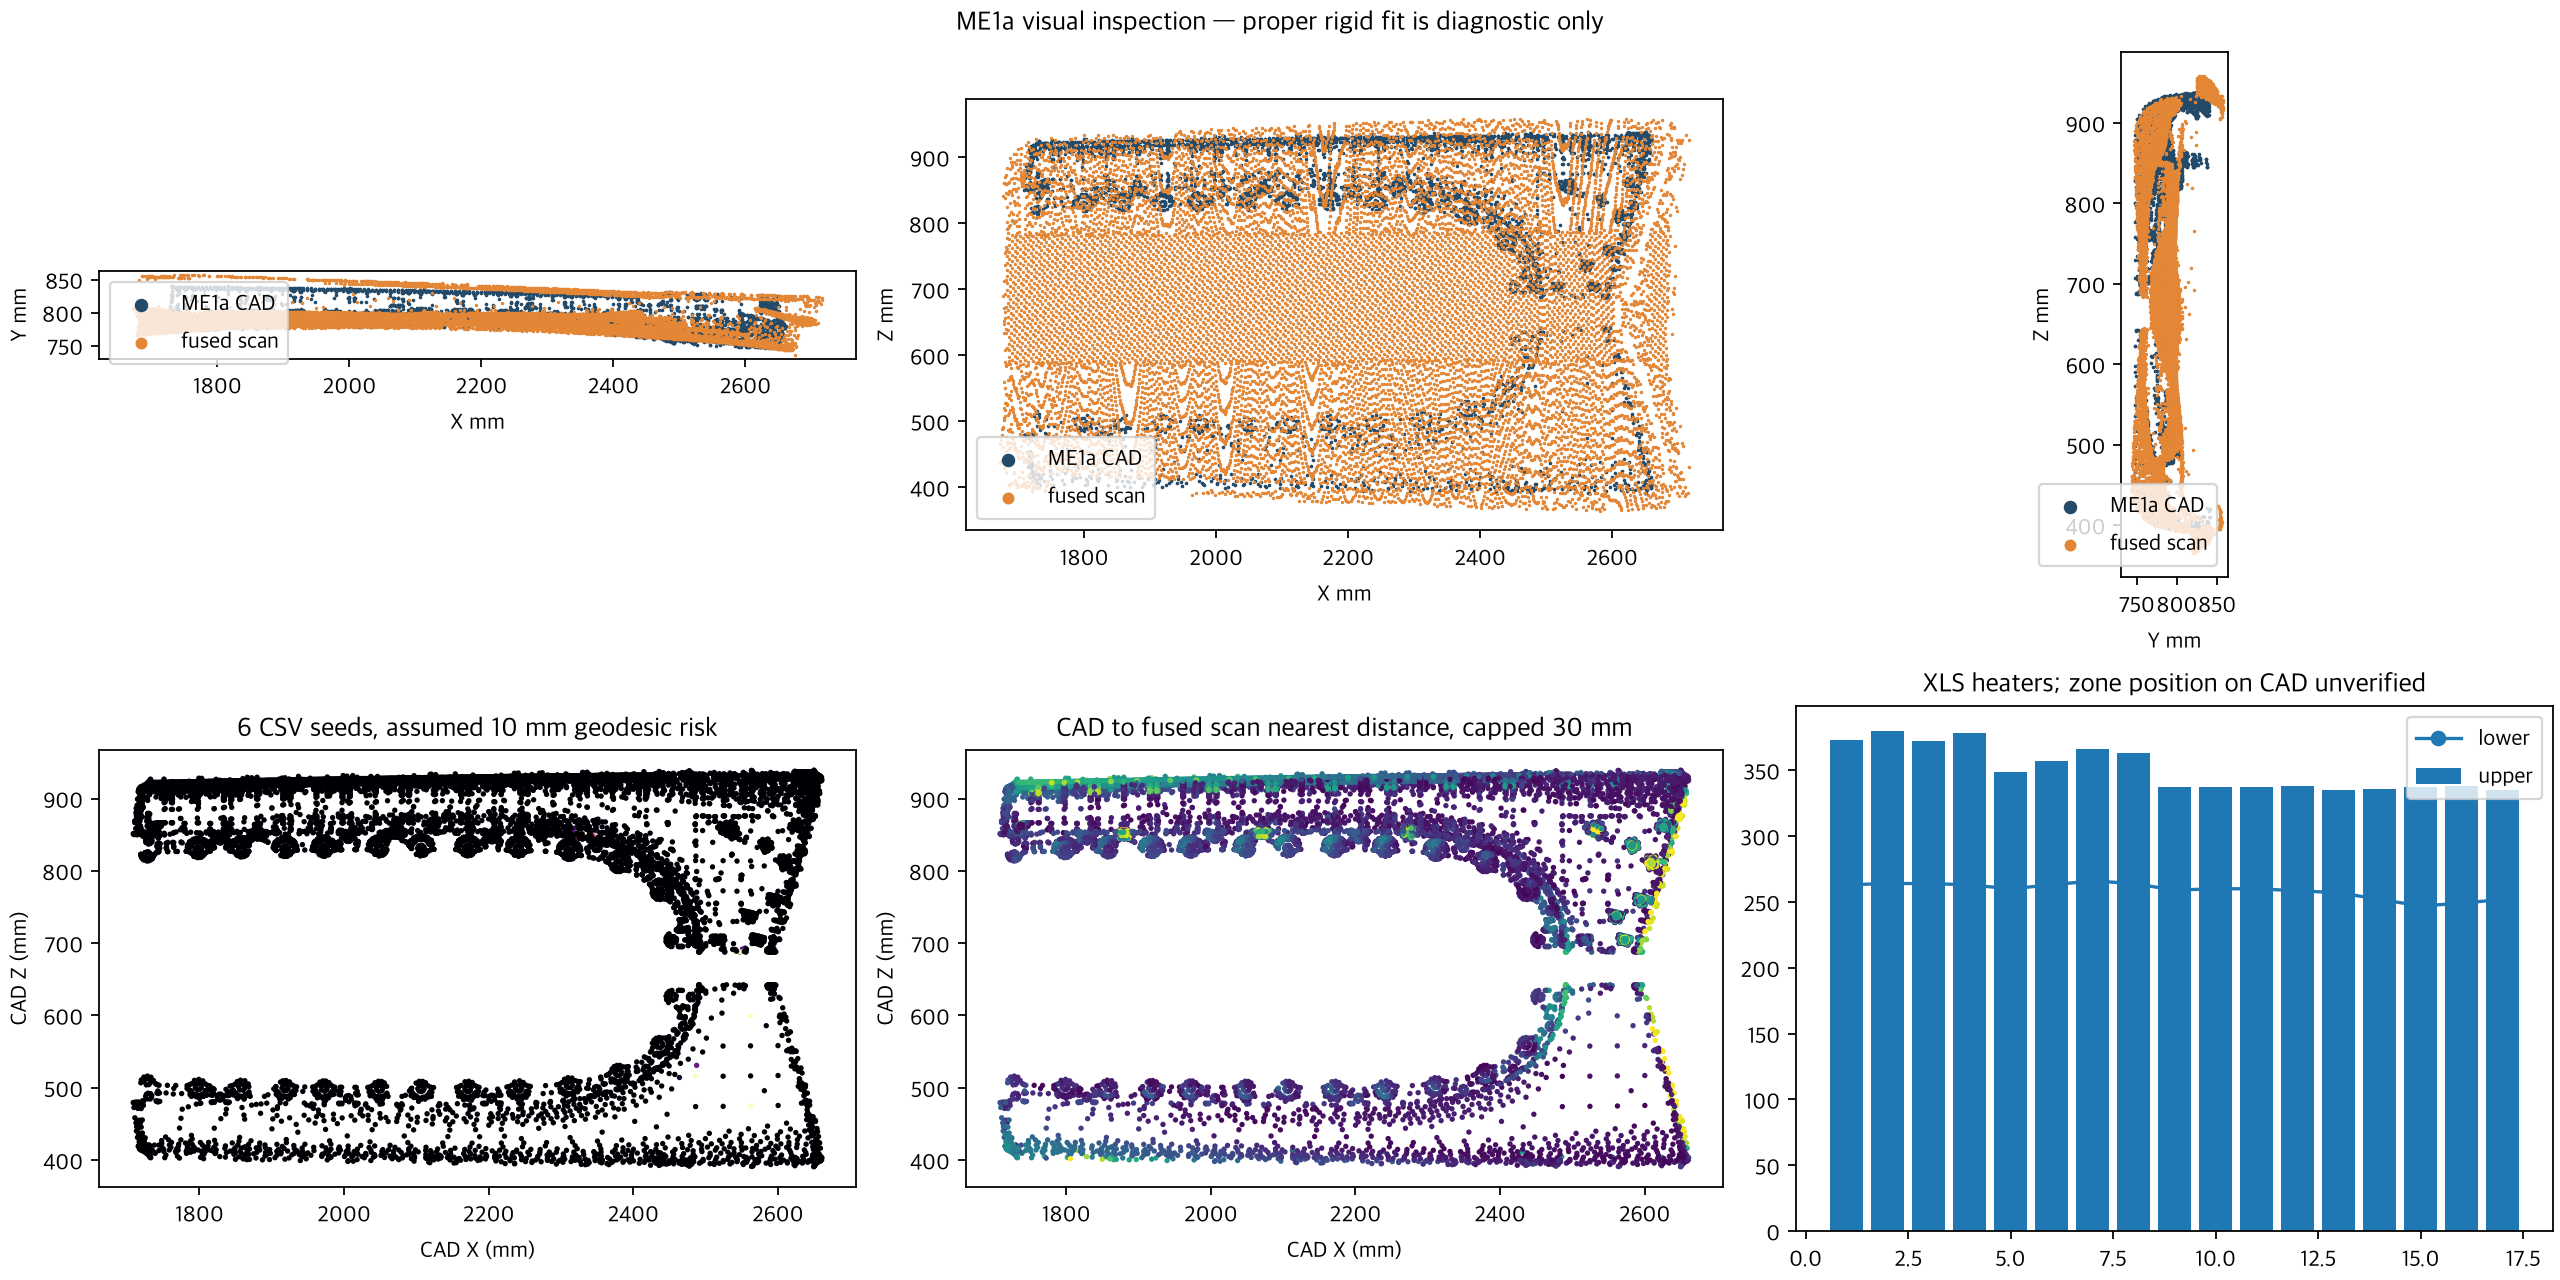
All six PLY files have finite vertices. The component scans are five views of one run. The merged-height raster matches sampled PLY heights at P90 0.048 mm. The automatic rigid pose has capped 80 mm RMSE 43.08 mm, so residual/deformation values remain diagnostic.

Six CSV defect marks on merged imageFused and component PLY scansCAD and fused PLY fit with diagnostic targets

Annotation and pose review JSON · All PLY audit JSON · ME1a preprocessing gallery

All model weak-label fits

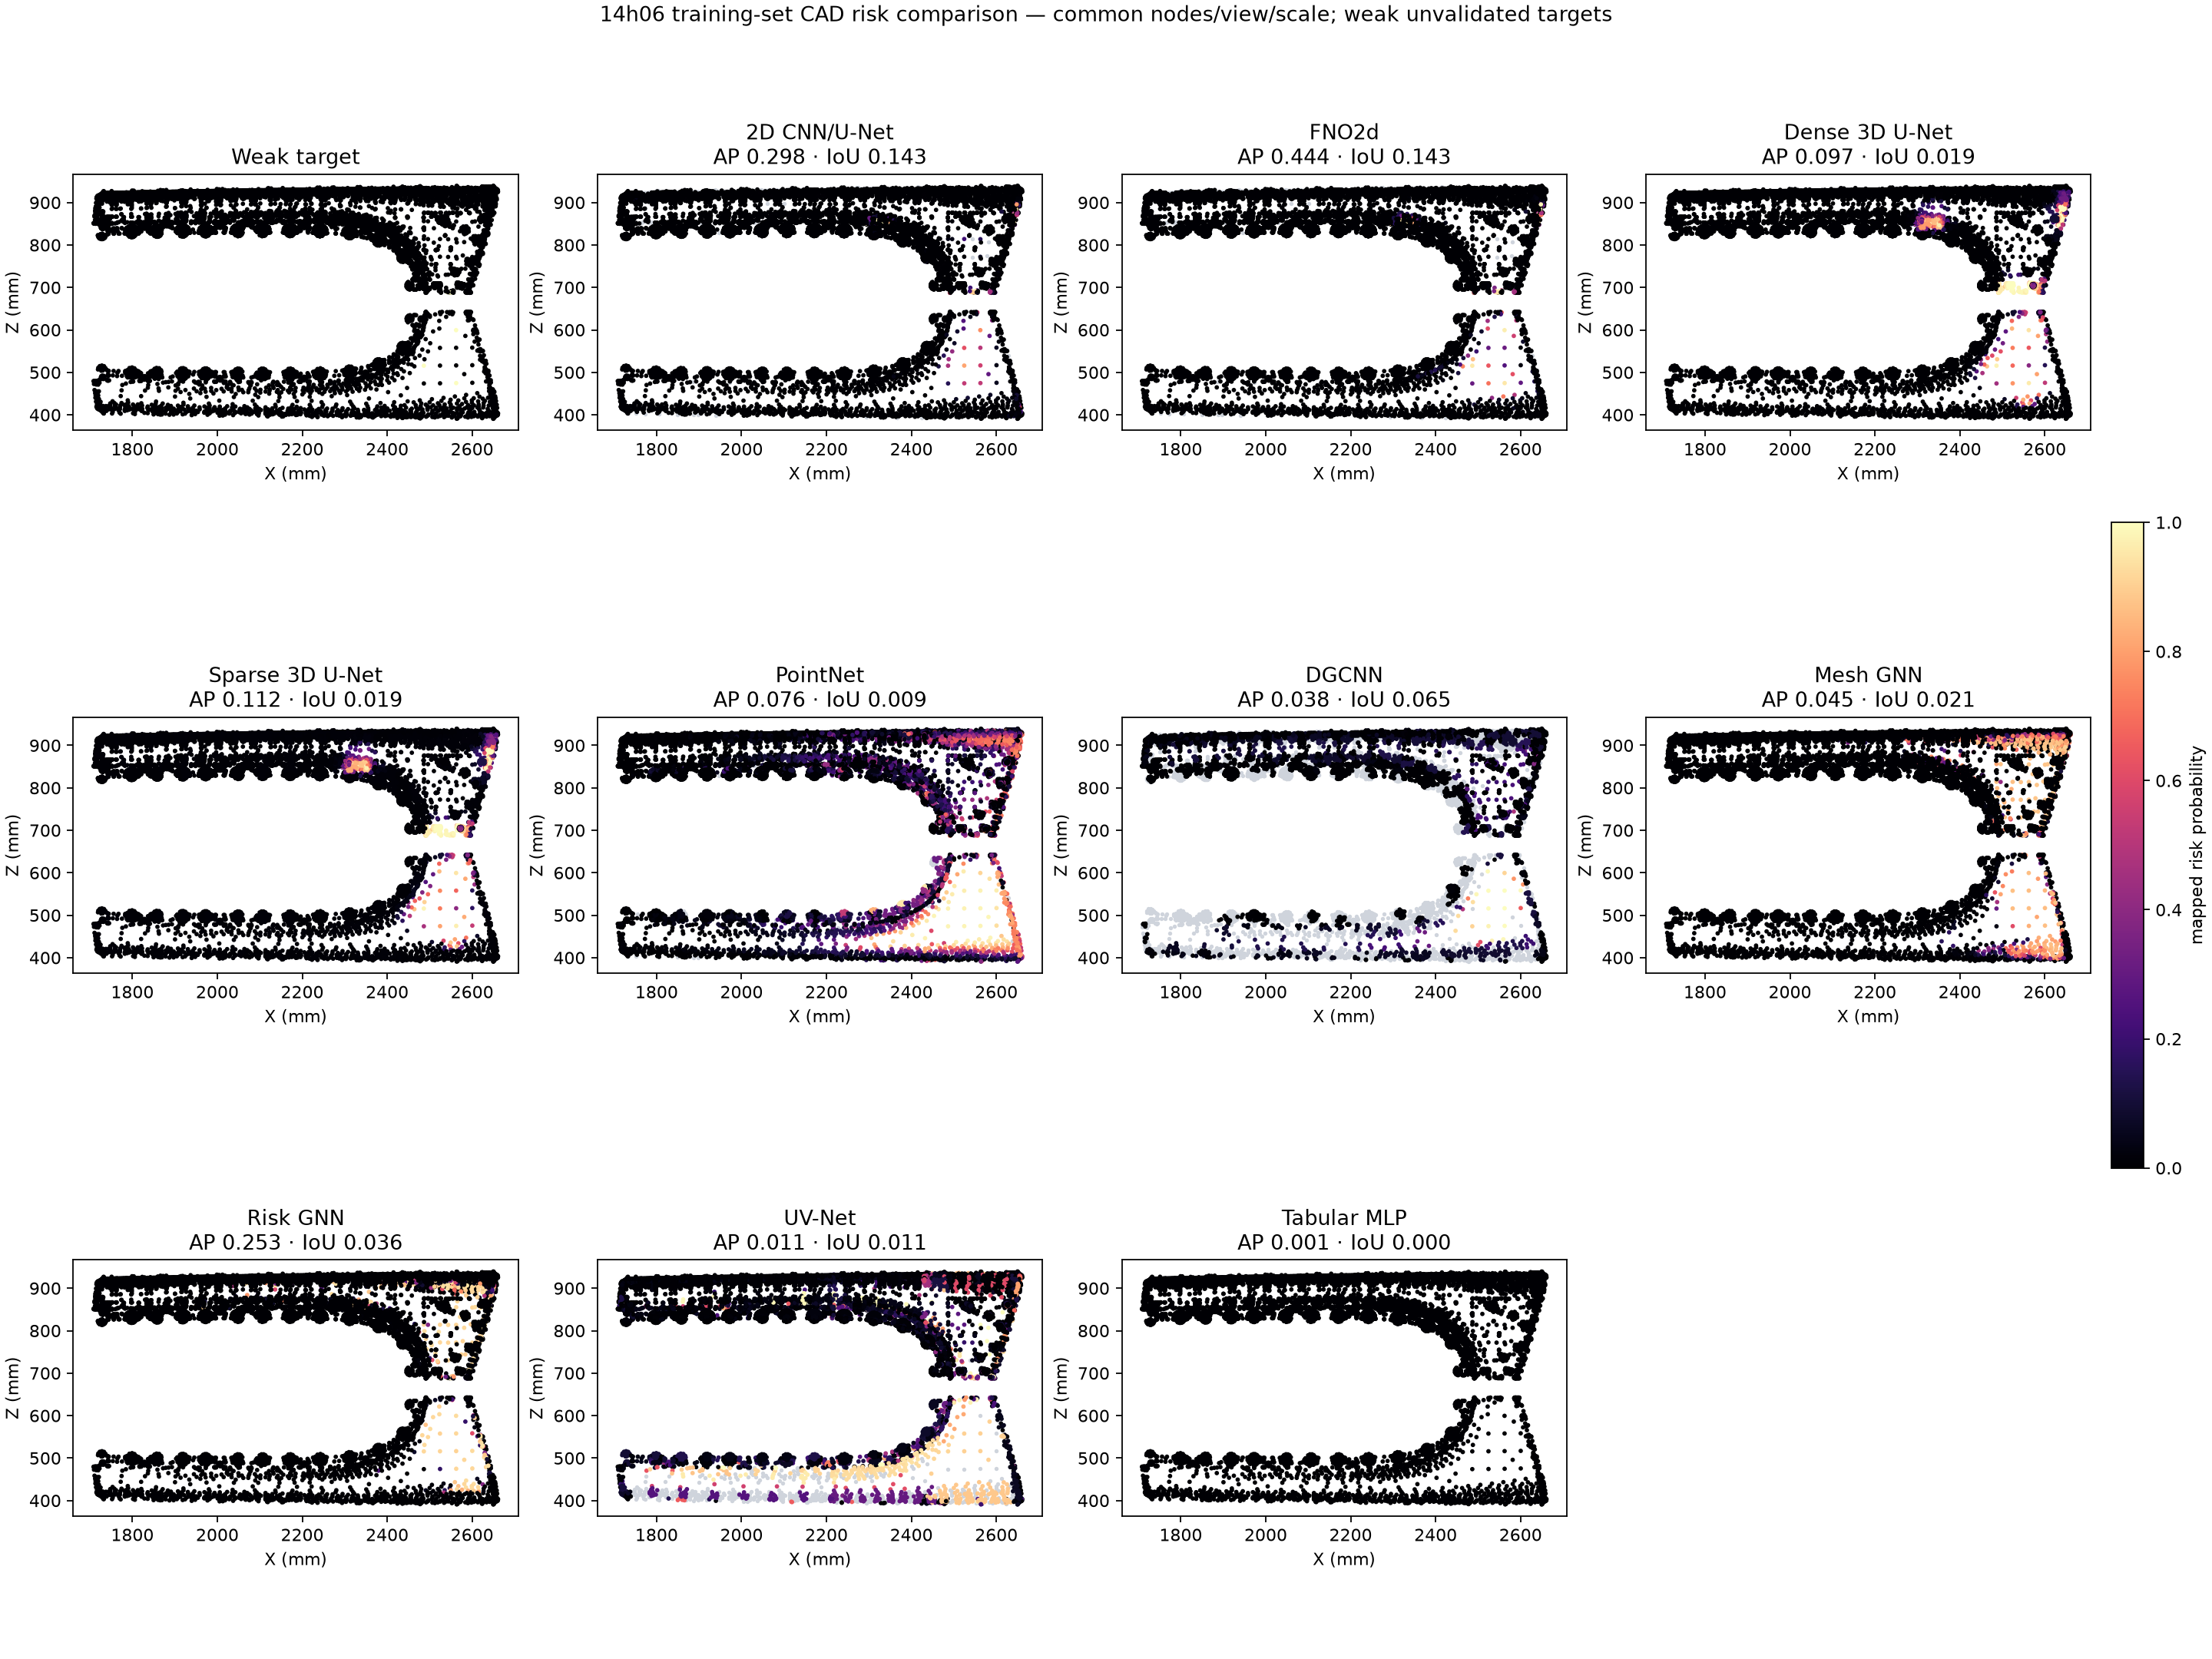
Ten model families fit the same ME1a diagnostic mask. AP, IoU and Dice are measured on that training run. AC28 columns show its own separate weak-label training run and are included for traceability, not a performance ranking. The constrained GNN's 400-epoch training IoU was 0.036.

ModelEpochsME1a lossME1a APME1a IoUME1a DiceCAD map coverageAC28 APAC28 IoU
2D CNN/U-Net801.0840.2980.1430.2500.9220.6220.333
FNO2d600.7650.4440.1430.2500.9220.6200.296
Dense 3D U-Net1000.5920.0970.0190.0371.0000.3580.048
Sparse 3D U-Net1000.6720.1120.0190.0371.0000.3590.047
PointNet1201.4860.0760.0090.0170.9970.0930.114
DGCNN1001.2980.0380.0650.1220.6300.0020.000
Mesh GNN1001.1620.0450.0210.0401.0000.7580.147
Risk GNN4001.0230.2530.0360.0701.0000.7640.309
UV-Net1001.2080.0110.0110.0210.9660.0760.043
Tabular MLP1200.0000.0010.0000.0001.0000.0020.000
All ME1a weak-fit model predictions on one CAD

ME1a model image gallery and checkpoints · All model metrics JSON · Constrained GNN training · Architecture execution report · AC28 model results

Conditional diffusion diagnostics

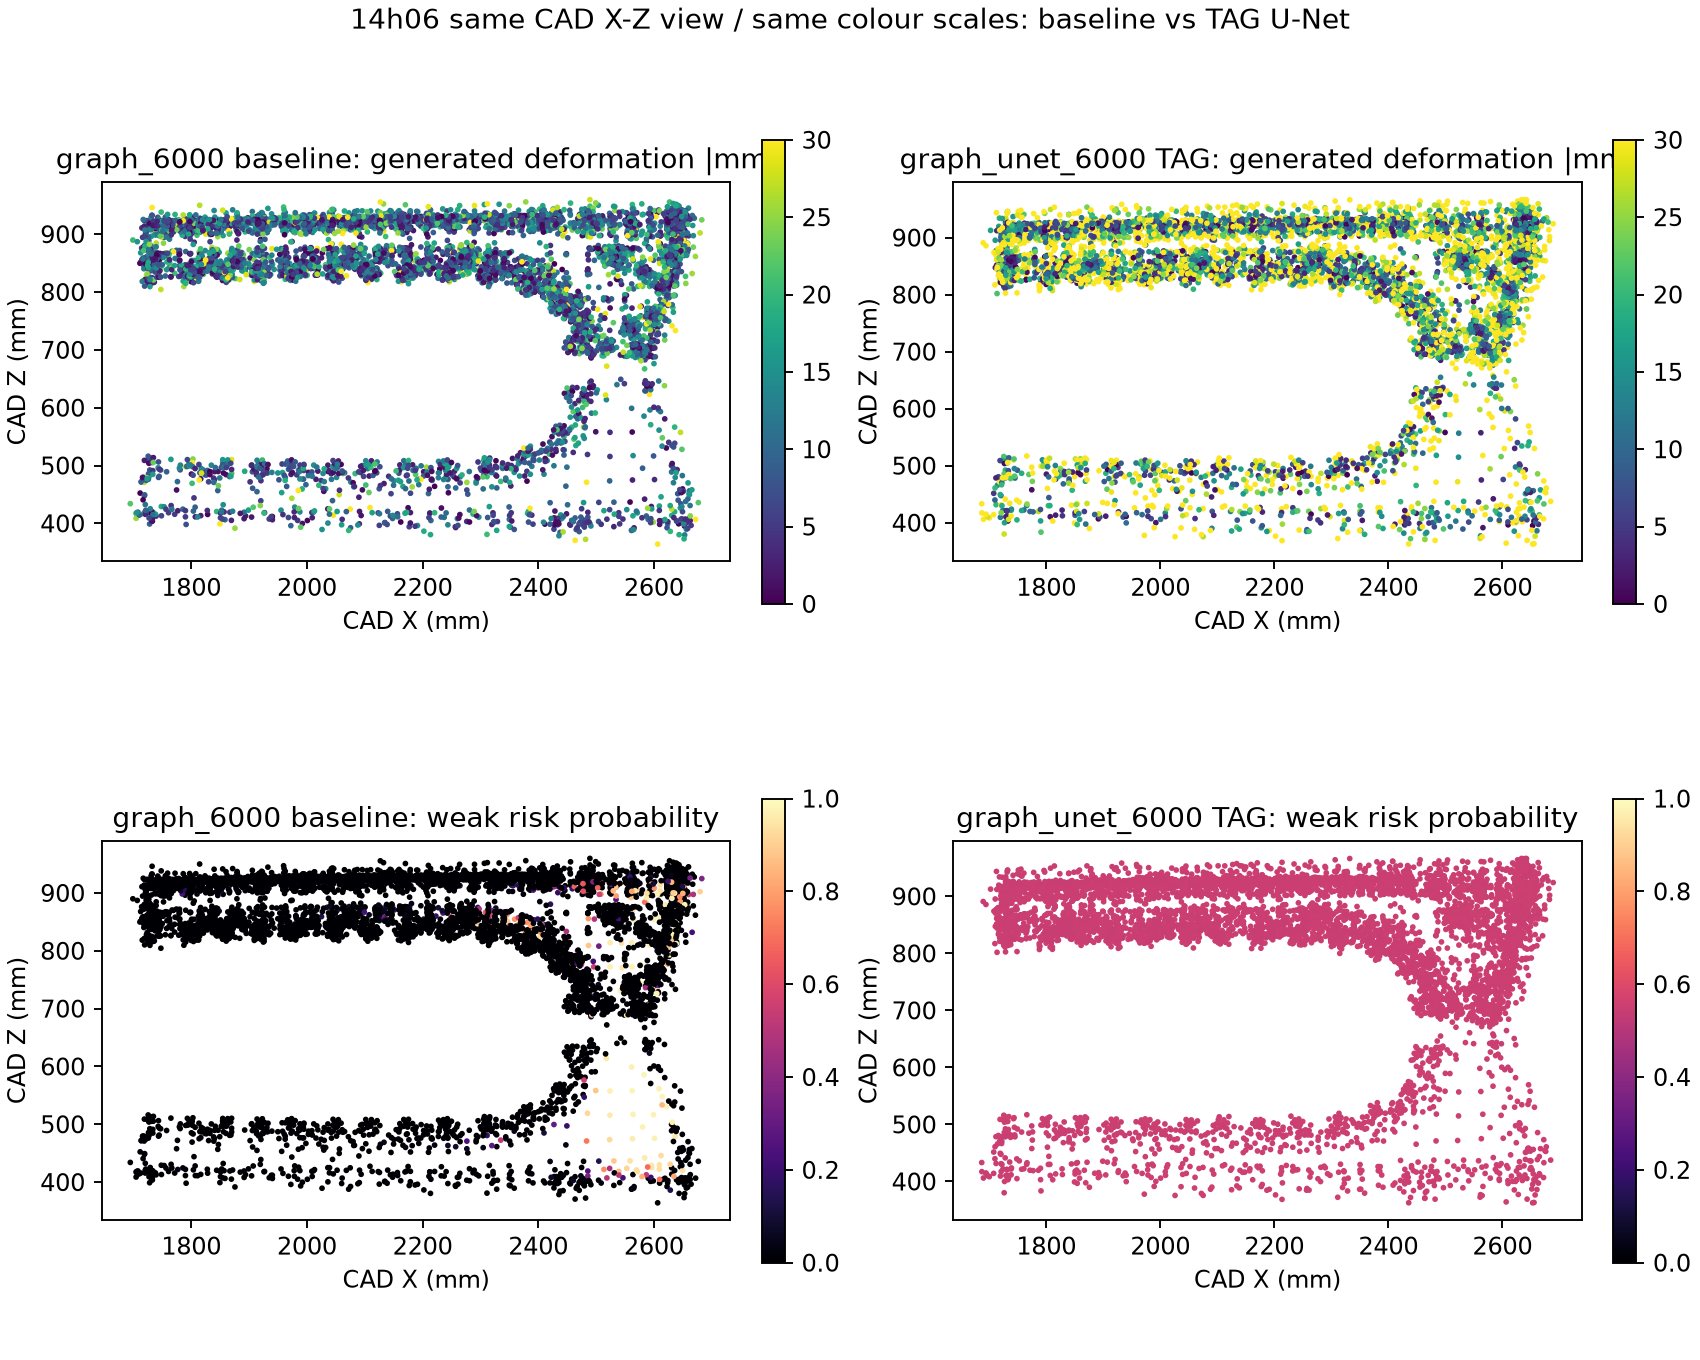
Four representation-specific denoisers and the TAG Graph U-Net were fitted on the one ME1a run. Deformation MAE uses an unvalidated nearest-scan target. Weak risk AP and IoU are measured on that same run, so these values do not establish generation or prediction quality.

VariantNodes/runBest lossDeformation MAE mmWeak risk APWeak risk IoU
image_2d6,0000.5985.7380.1430.055
voxel_3d2,5920.5486.1030.2350.057
point_60006,0000.5765.6450.0580.011
graph_60006,1550.4305.9140.1770.039
graph_unet_60006,1550.7389.6350.0060.001
Four ME1a diffusion variantsGraph baseline and TAG U-Net on ME1a

Diffusion gallery, generated clouds and checkpoints · Five-variant report JSON · AC28 diffusion gallery

Can one GNN learn from both parts?

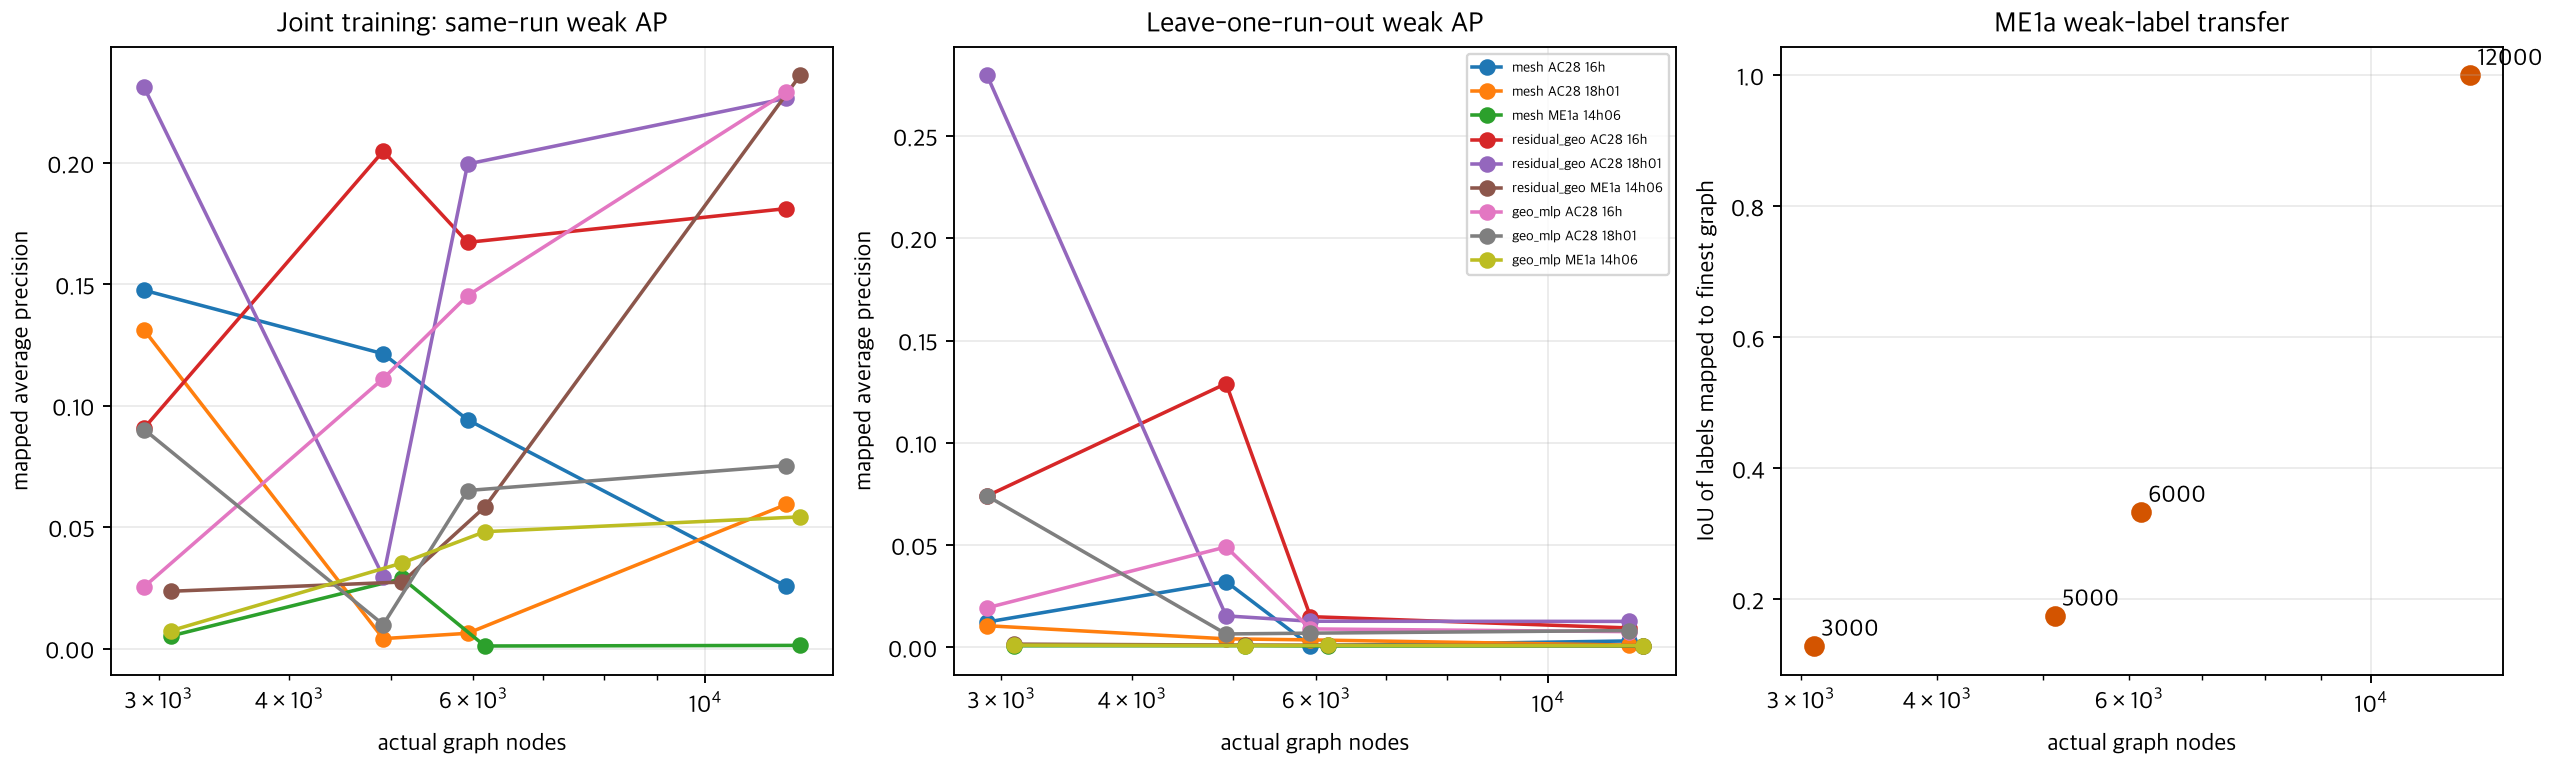
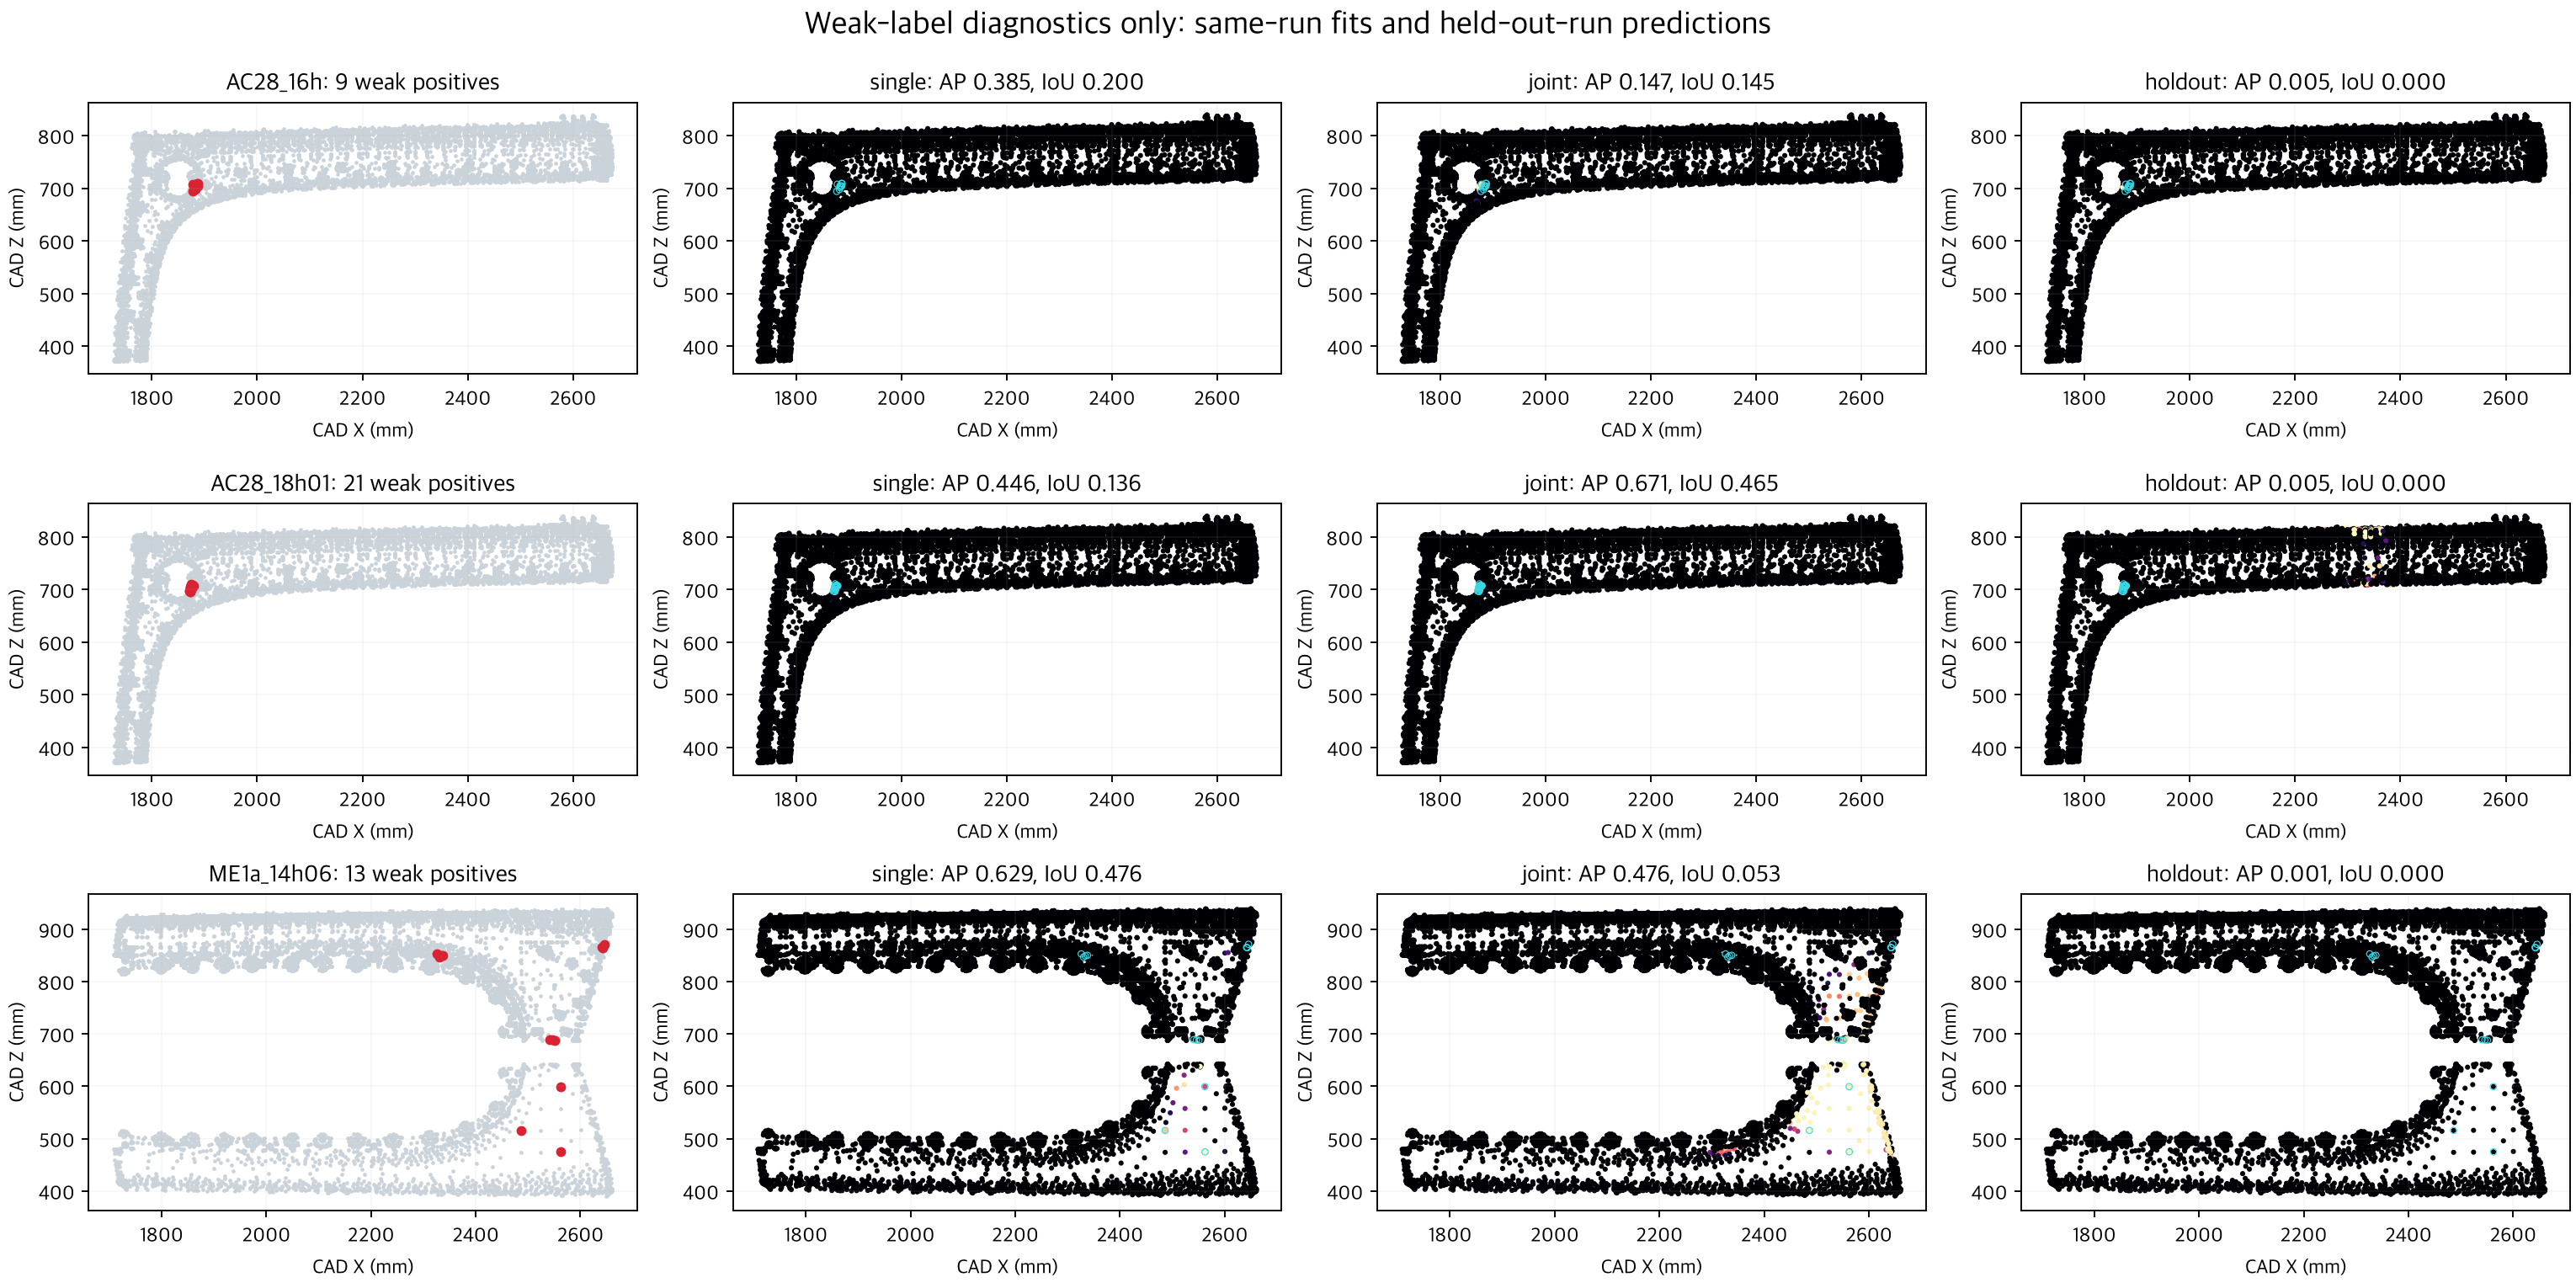
The residual geometric GNN was compared with the prior Mesh GNN and a coordinate MLP control at 3k, 5k, 6k and 12k graph budgets. The optimized 12k fit uses hard, class-balanced provisional masks. Individual and joint scores are measured on their training runs; held-out scores predict a run excluded from fitting.

RunIndividual APIndividual IoUJoint APJoint IoUHeld-out APHeld-out IoU
AC28_16h0.3850.2000.1470.1450.00470.000
AC28_18h010.4460.1360.6710.4650.00460.000
ME1a_14h060.6290.4760.4760.0530.00100.000

Result: ME1a individual fit AP 0.629 / IoU 0.476 exceeds its previous FNO same-run 0.444 / 0.143, but held-out ME1a AP is near chance and IoU is zero. Adding ME1a did not consistently improve held-out AC28 prediction. Node choice: use 12k requested nodes (11,956 AC28; 12,324 ME1a actual) for spatial outputs. ME1a's 5k graph has 5,132 actual nodes and retains only 0.175 of the finest weak mask by IoU; its 6k graph retains 0.333 and 3k retains 0.129. This choice protects localized labels; it is not a validated predictive optimum.

GNN variants and node sizes, joint and held-out resultsIndividual, pooled and held-out GNN prediction maps

Risk GNN versus every other model · Four-size architecture experiment · Optimized 12k GNN and pooling experiment · All optimized per-run metrics CSV

Prepared inputs

ME1a has six CAD image views at 128²/256², sparse surface voxels at 32/64/128, one 8,192-point CAD set, a separate 8,192-point post-scan diagnostic set, tabular XLS conditions and the trimmed B-Rep face graph. The scan is an outcome used for target construction, not a pre-process predictor.

Images · Voxels · Points · Process table · B-Rep · AC28 inputs · Full written summary